Analyzing data
Preprocessing
To aggregate sample data with mean and standard deviation, a
preprocessing step is required. This is accomplished using the script
dev/aggregate.py. The script processes the raw data collected during
benchmarking and computes the necessary statistical measures for
analysis.
Setting Up the Environment
Before running the preprocessing script, ensure that you have a suitable
Python environment. You can create a virtual environment and install the
necessary dependencies using the requirements.txt file. This ensures
that all required packages are available for the script to run smoothly.
python3 -m venv env
source env/bin/activate
pip install -r requirements.txt
Preprocessing Script
The dev/aggregate.py script requires two arguments to function
correctly:
Path to the TOML File: This is the configuration file used during the benchmarking process. It contains the parameters and tasks that were executed.
Output Directory: This is the directory where the aggregated data will be stored after processing.
To run the script, use the following command:
python dev/aggregate.py <path/to/toml> <path/to/output_directory>
For example, running the following commands produces:
python dev/aggregate.py examples/demo.toml aggregated
tree aggregated

aggregated/
├── dd-1
│   ├── deep-trace
│   │   ├── io.csv
│   │   ├── package-0-core.csv
│   │   ├── package-0.csv
│   │   ├── perf.csv
│   │   ├── stderr
│   │   ├── stdout
│   │   └── trace.csv
│   ├── io.csv
│   ├── package-0-core.csv
│   ├── package-0.csv
│   └── perf.csv
├── nbody-1
│   ├── deep-trace
│   │   ├── io.csv
│   │   ├── package-0-core.csv
│   │   ├── package-0.csv
│   │   ├── perf.csv
│   │   ├── stderr
│   │   ├── stdout
│   │   └── trace.csv
│   ├── io.csv
│   ├── package-0-core.csv
│   ├── package-0.csv
│   └── perf.csv
├── nbody-2
│   ├── deep-trace
│   │   ├── io.csv
│   │   ├── package-0-core.csv
│   │   ├── package-0.csv
│   │   ├── perf.csv
│   │   ├── stderr
│   │   ├── stdout
│   │   └── trace.csv
│   ├── io.csv
│   ├── package-0-core.csv
│   ├── package-0.csv
│   └── perf.csv
└── nbody-4
    ├── deep-trace
    │   ├── io.csv
    │   ├── package-0-core.csv
    │   ├── package-0.csv
    │   ├── perf.csv
    │   ├── stderr
    │   ├── stdout
    │   └── trace.csv
    ├── io.csv
    ├── package-0-core.csv
    ├── package-0.csv
    └── perf.csv
Perf Aggregation
Perf output is aggregated by calculating the mean and standard deviation for each counter. The output appears as follows.
cat /tmp/demo-processed/bonnie++-1-untrusted/perf.csv

event,counter_mean,counter_std,counter_unit,metric_mean,unit_metric,perc_runtime_mean
L1-dcache-load-misses,5113360521.6,103267837.73247407,,3.4019999999999997,of all L1-dcache accesses,31.0
L1-dcache-loads,150305474853.2,205182282.16844067,,1.1228,G/sec,31.0
L1-dcache-prefetches,1269258560.2,52122983.51175186,,9.4724,M/sec,31.0
L1-icache-load-misses,2304340677.4,19231482.942564532,,1.078,of all L1-icache accesses,31.0
L1-icache-loads,214014918517.2,261940713.8728049,,1.5986,G/sec,31.0
branch-instructions,80574228395.8,171678771.61877853,,601.847,M/sec,31.0
branch-load-misses,9837754039.2,26359858.744911663,,73.4822,M/sec,31.0
branch-loads,80564398959.6,163850241.16953686,,601.7755999999999,M/sec,31.0
branch-misses,9836256318.8,24316591.9320201,,12.206,of all branches,31.0
....
Energy Measurement Aggregation
Energy measurements are aggregated using the coalescing window
method. This involves grouping energy samples into fixed time
intervals, or windows, to align them with other data samples. By
default, the window size (W) is set to 100ms. Within each
window, energy samples are averaged to compute the mean and standard
deviation. This ensures energy data is accurately represented over
consistent time intervals, allowing for meaningful comparisons with
other metrics collected during benchmarking.
head  /tmp/demo-processed/launch_nbody.sh-1-untrusted/package-0.csv

,bin,relative_time,energy (microjoule)
0,0,0.0,20926838658.2
1,50018408,500184086.0,22027975500.0
2,50019136,500191369.0,21457430207.0
3,50023813,500238137.0,19852073423.0
4,50026094,500260940.0,20929957912.0
5,50031162,500311624.0,20389345794.0
6,100040329,1000403297.0,21462625388.0
7,100047796,1000477967.0,19856279871.0
8,100049695,1000496953.0,22029620099.0
Deep trace analysis
This figure (generate from deep-trace/trace.csv) presents two histograms illustrating system events over the duration of a Sysbench run (1 GB workload, 8 threads), binned by relative time:
Top subplot (System and Disk Events) Depicts system calls (
sys-read,sys-write) and disk I/O events (dsk-read,dsk-write). Each bar’s height indicates the count of that event type in the corresponding time bin. Notably,sys-readexhibits high spikes, suggesting periods of more intense read operations.Bottom subplot (Memory Allocation/Free Events) Shows memory-related operations (
mm-page-alloc,mm-page-free,kmalloc,kfree). The concentration of allocations at the start indicates setup overhead, while the large cluster of frees at the end points to cleanup and deallocation.
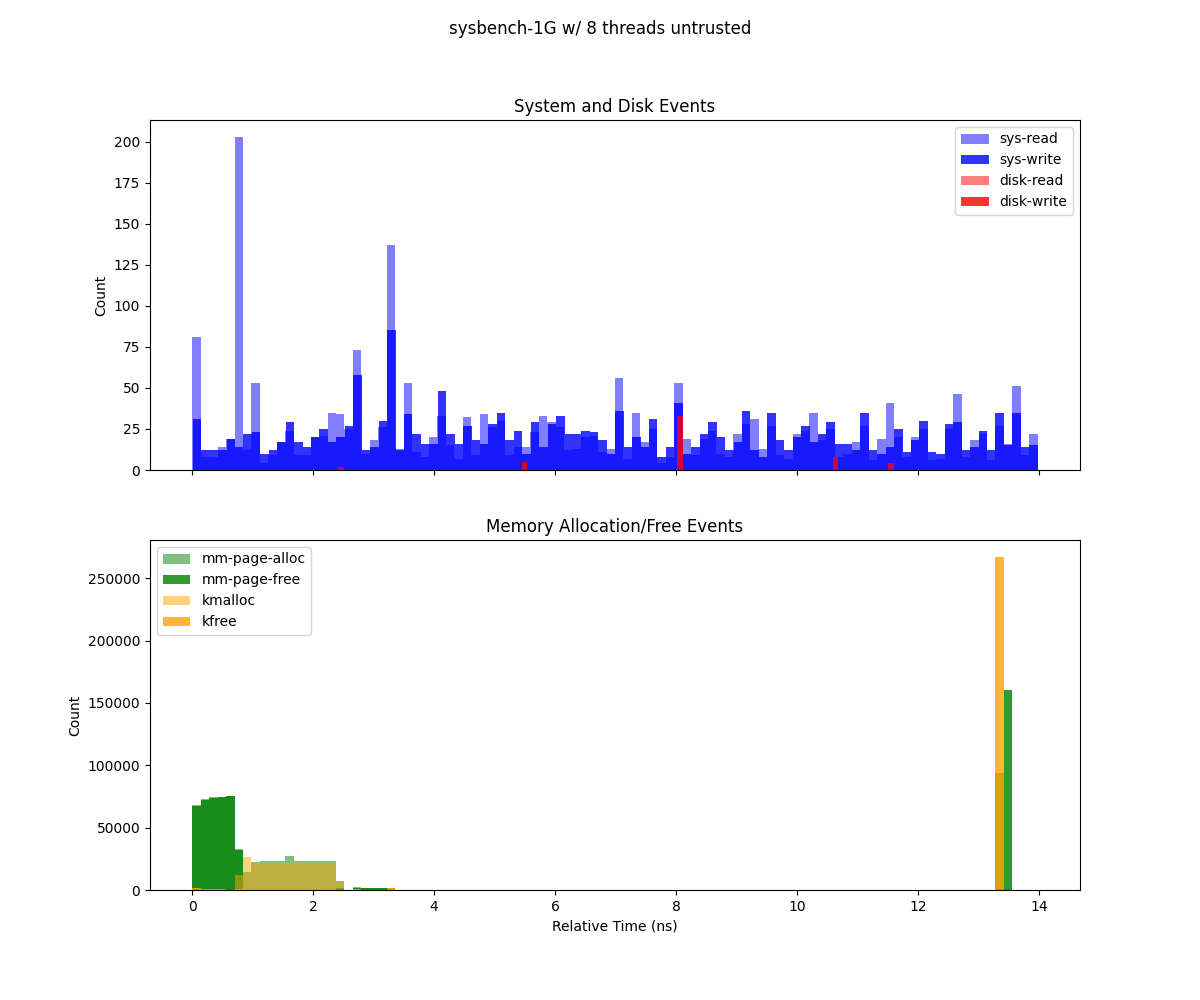
Sysbench executed using Gramine with 1Gb and 8 threads.
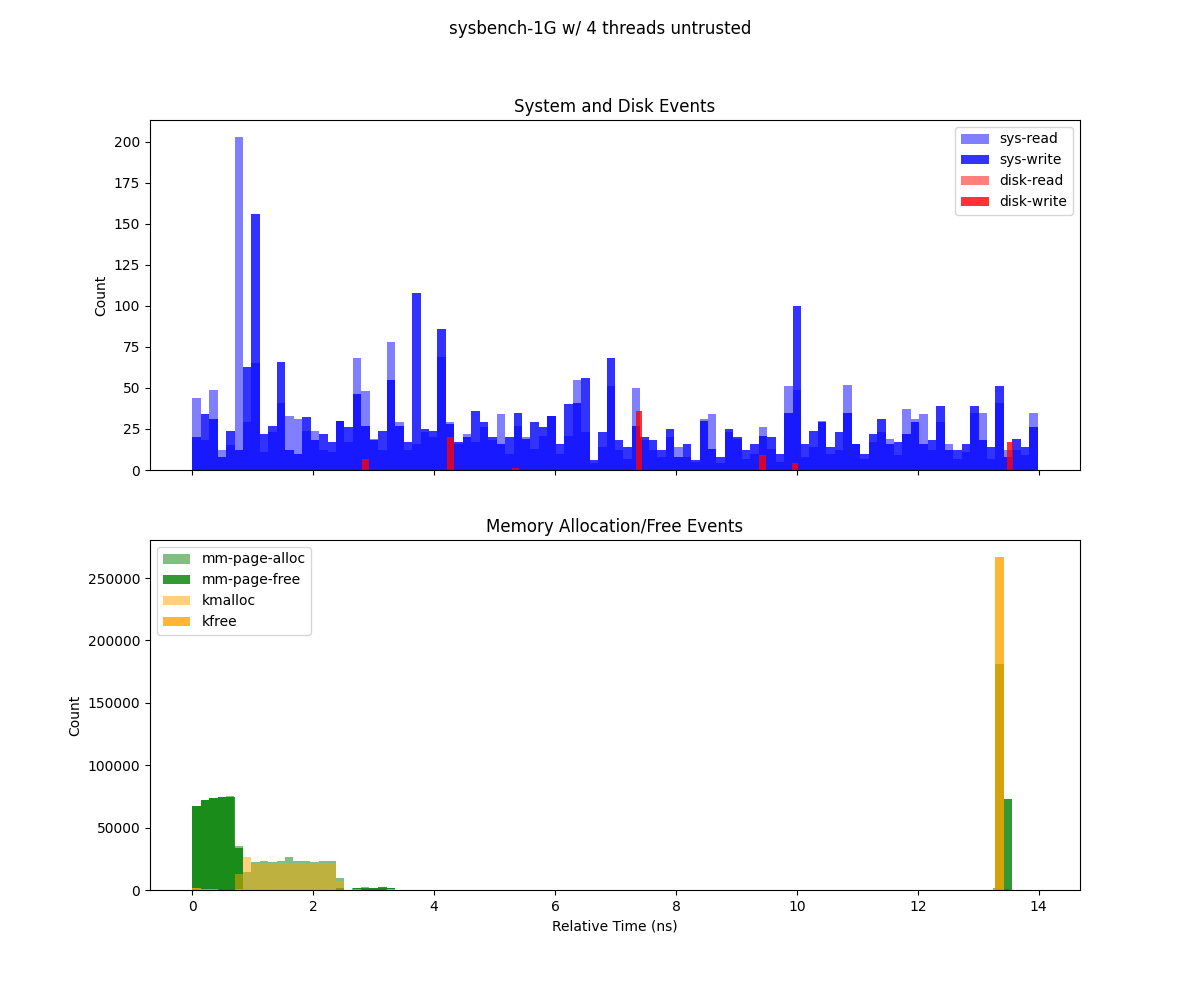
Sysbench executed using Gramine with 1Gb and 4 threads.
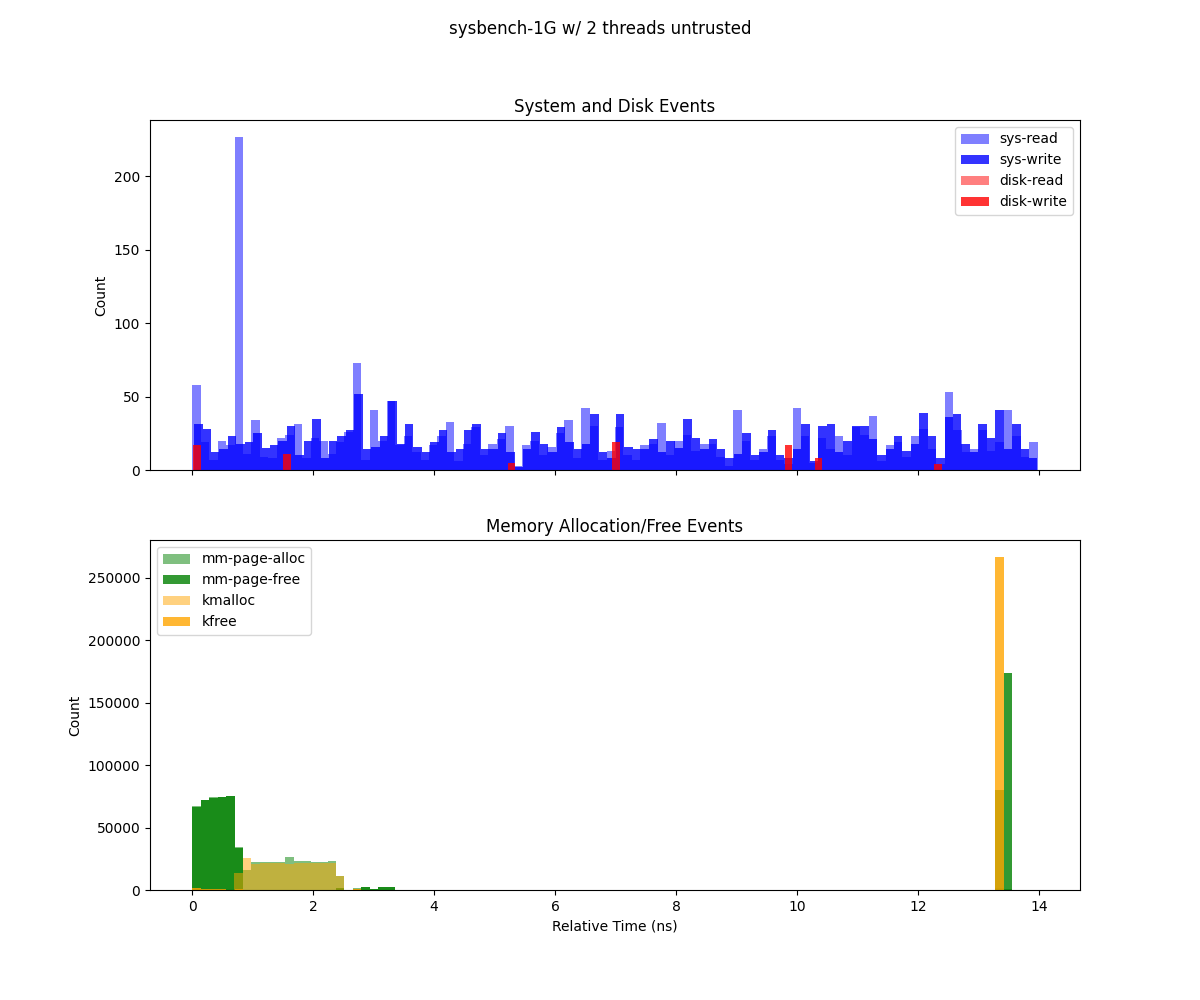
Sysbench executed using Gramine with 1Gb and 2 threads.
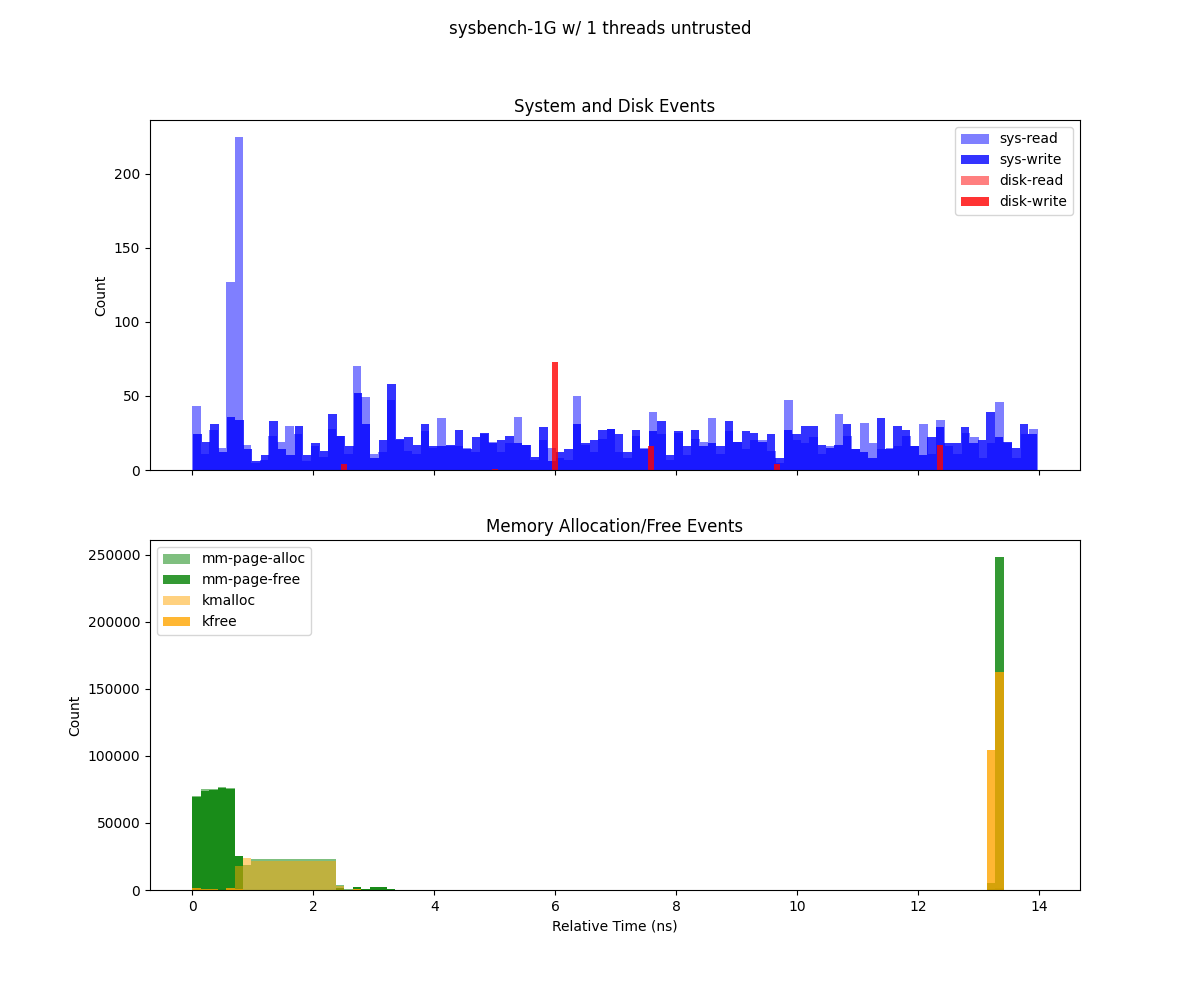
Sysbench executed using Gramine with 1Gb and 1 thread.
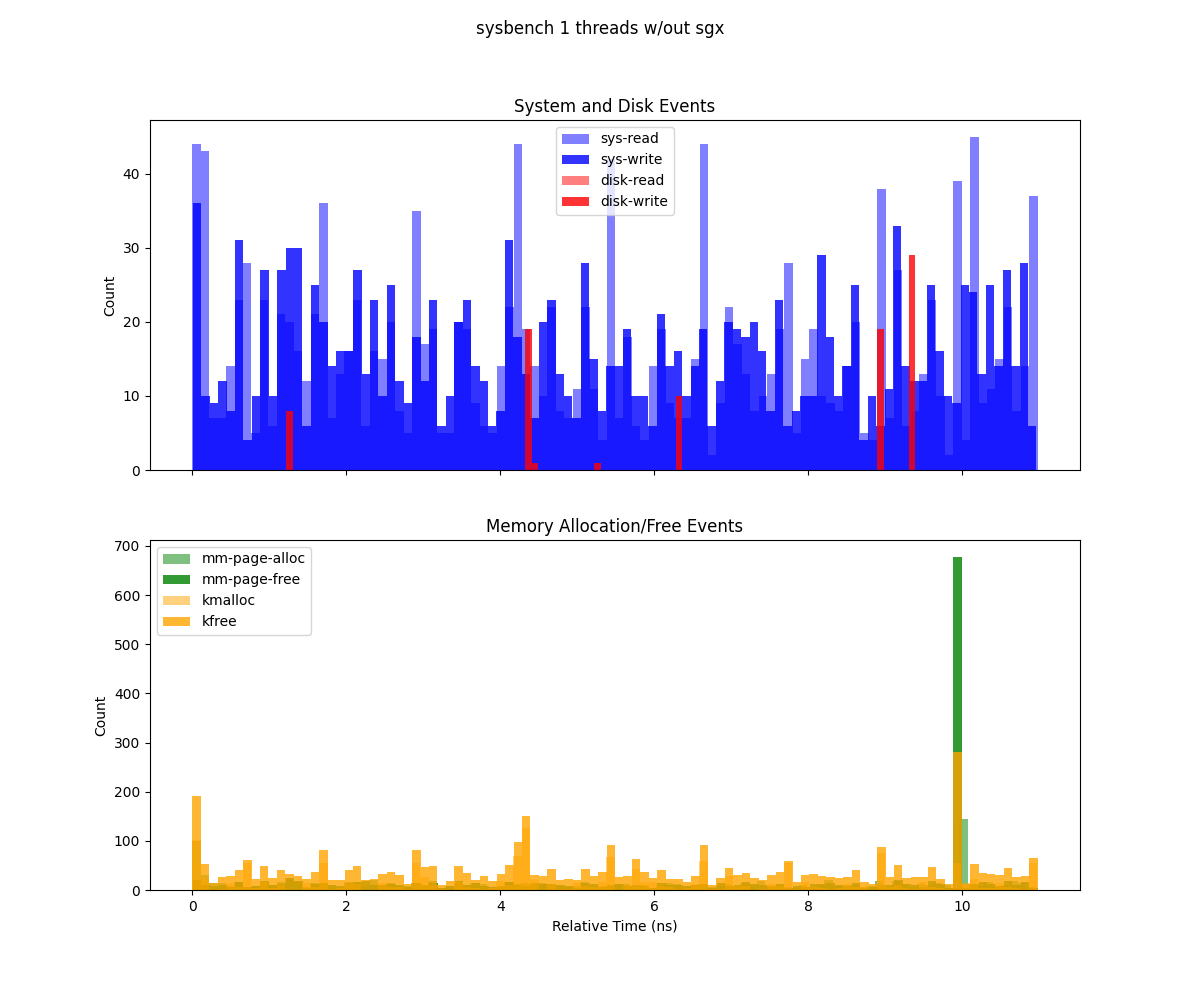
Sysbench executed without Gramine with 1 thread.
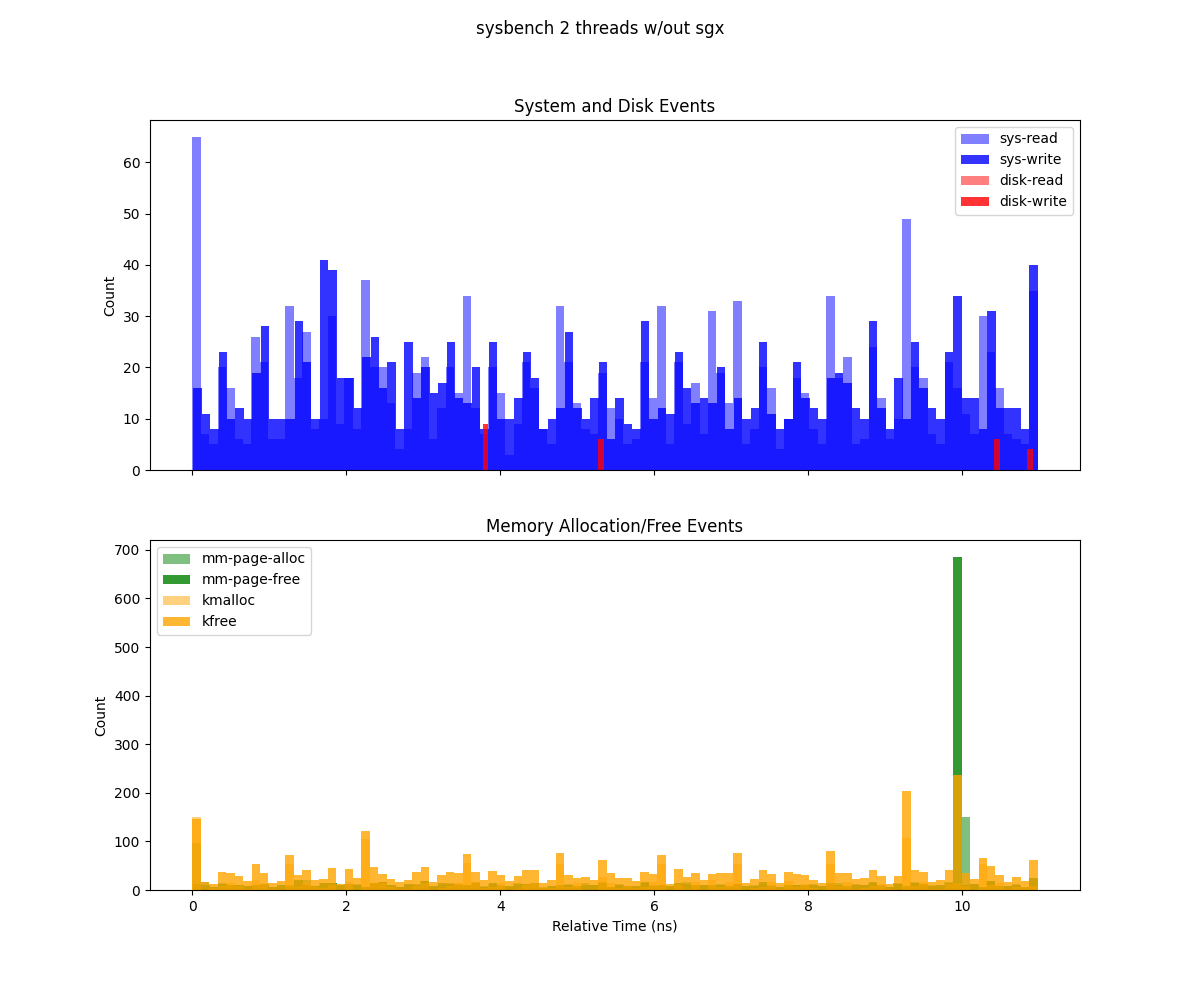
Sysbench executed without Gramine with 2 threads.
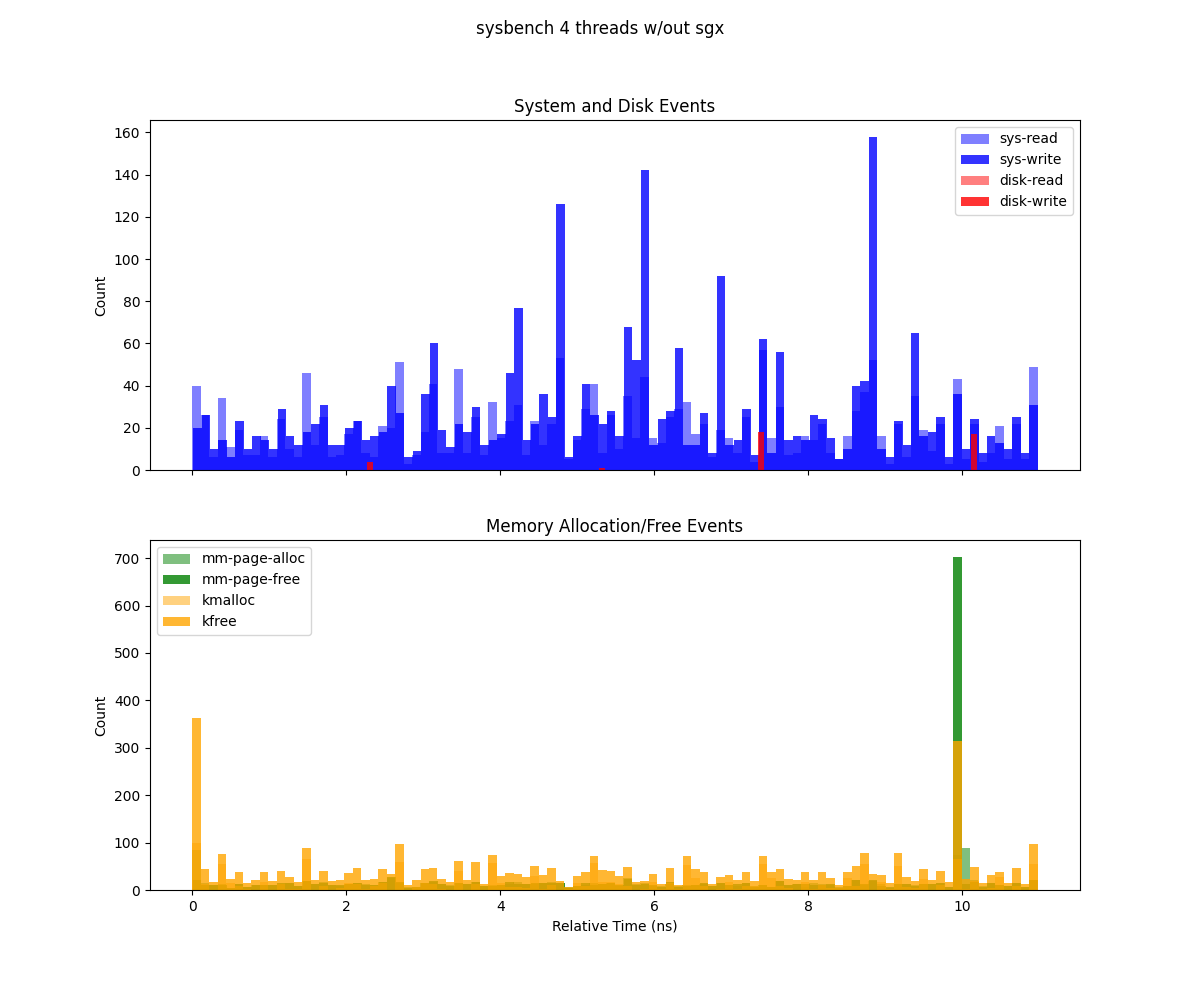
Sysbench executed without Gramine with 4 threads.
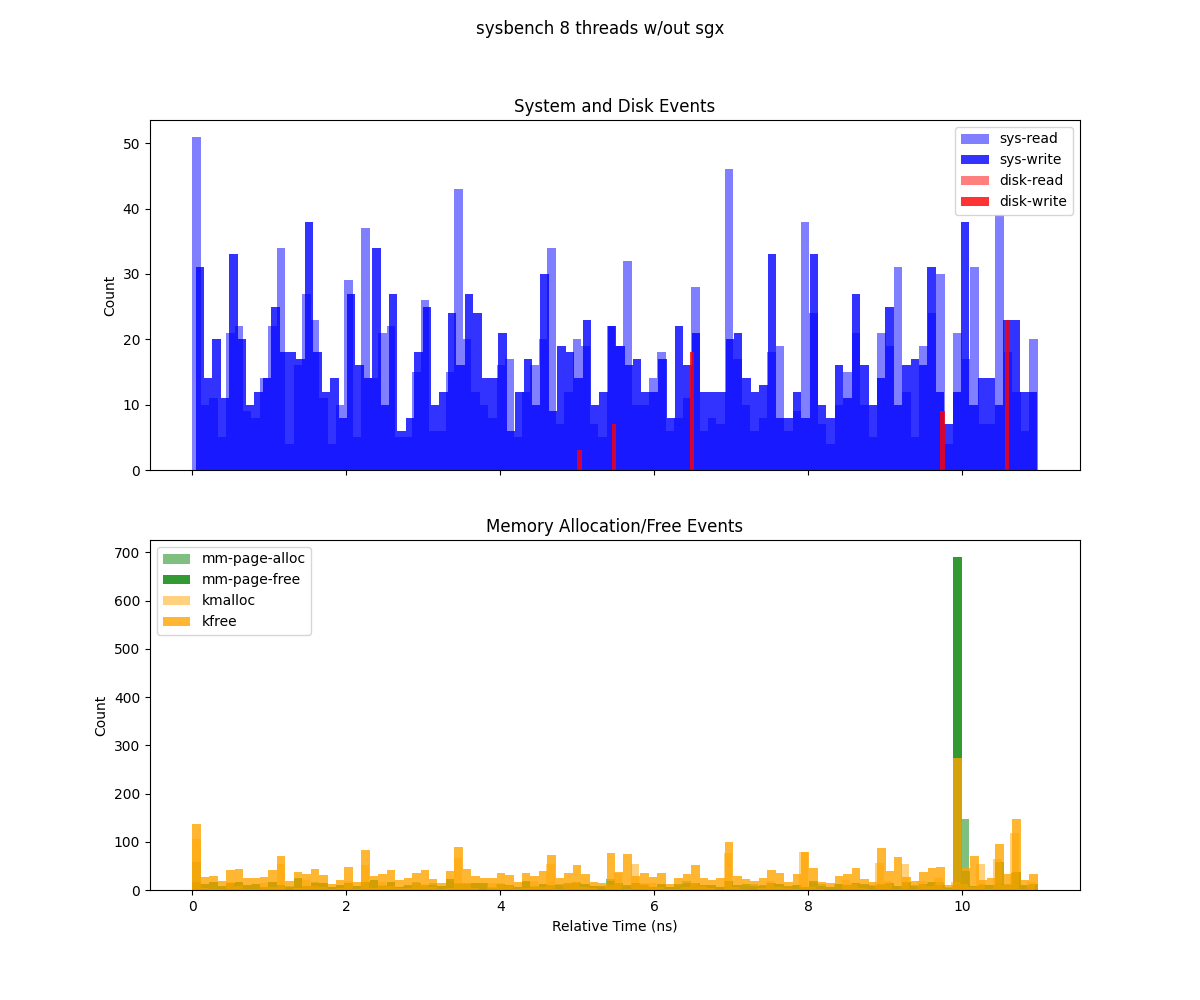
Sysbench executed without Gramine with 8 threads.
Following plots represents execution for the I/O bound test, Allocations, read and writes are at the beginning of the execution both for Gramine and non Gramine app.
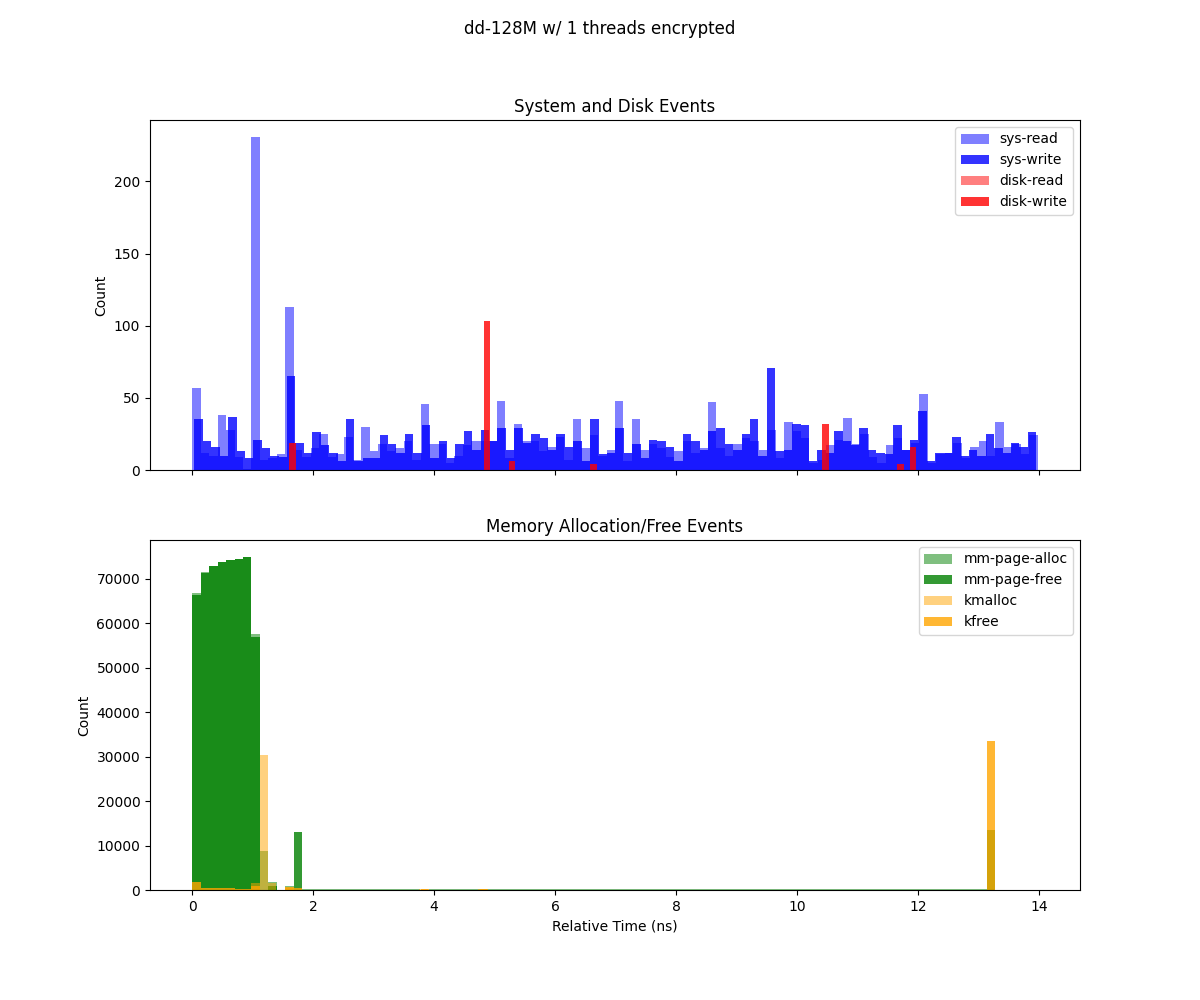
dd executed using encrypted storage in Gramine with 128M
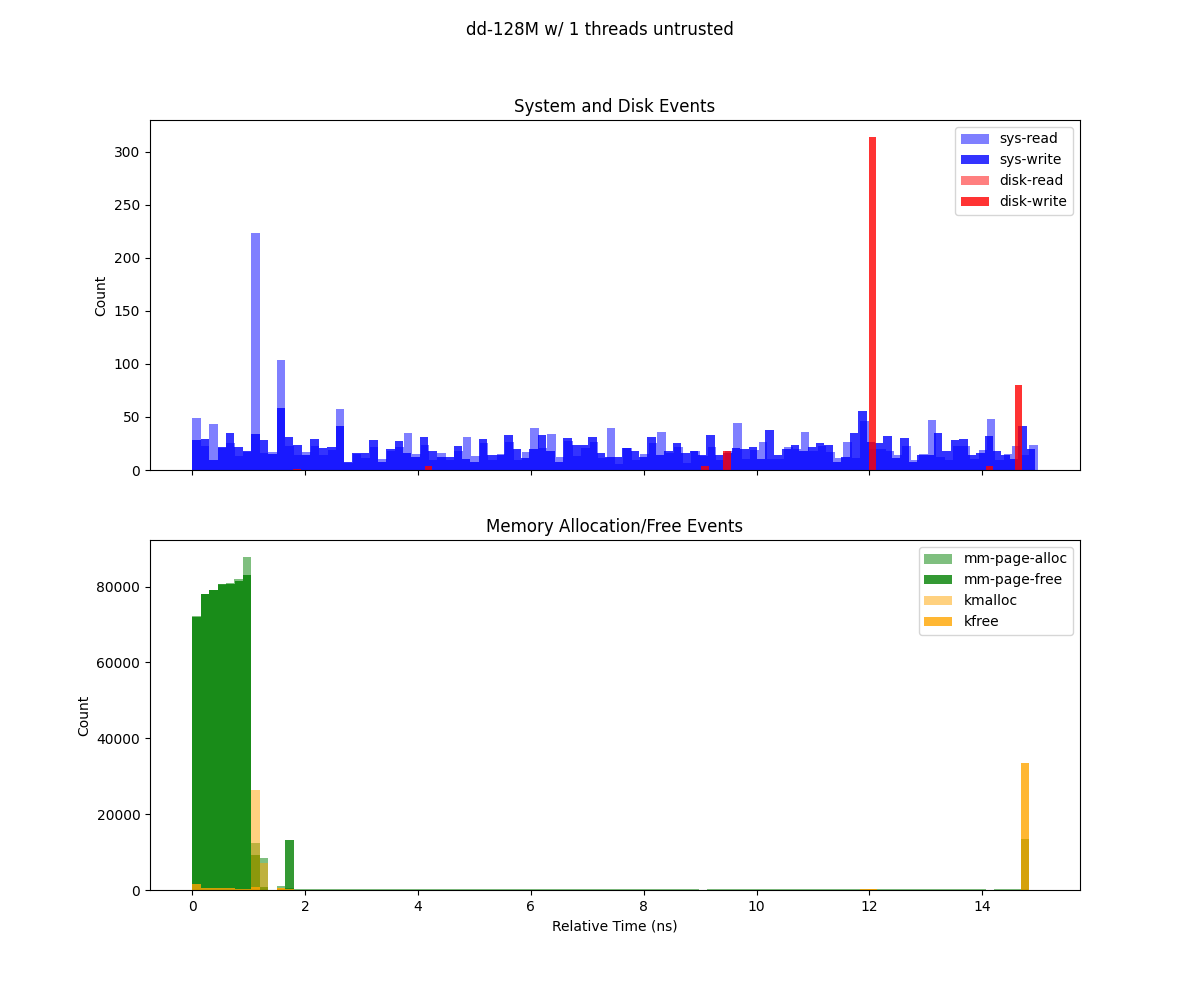
dd executed using unencrypted storage in Gramine 64M

dd executed without Gramine
Disk write analysis
This bar chart compares the percentage of sequential and random disk writes between two configurations: encrypted and untrusted.
Sequential Writes (%) (blue bars): - The
untrustedconfiguration exhibits a significantly higher percentage of sequential writes compared toencrypted.Random Writes (%) (orange bars): - The
encryptedconfiguration has a higher proportion of random writes compared tountrusted, where random writes are notably lower.
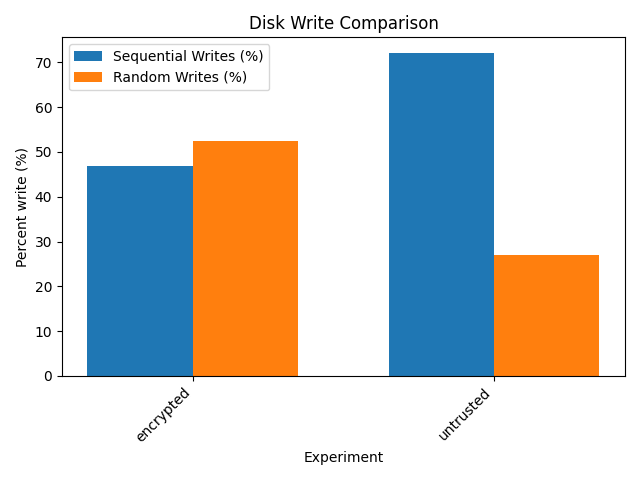
Disk write analysis for an enclave 128Mb size
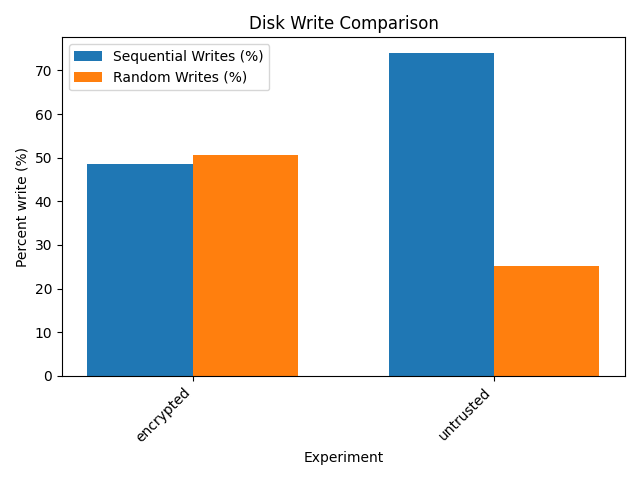
Disk write analysis for an enclave 64Mb size
Perf analysis
The following plots compares results from the perf command. Since perf reads CPU
counters results are shown for the sysbench application.
Cache misses are very high during SGX execution. This is highly due to the fact that
when an enclave starts the execution, TLBs and Caches are flushed.
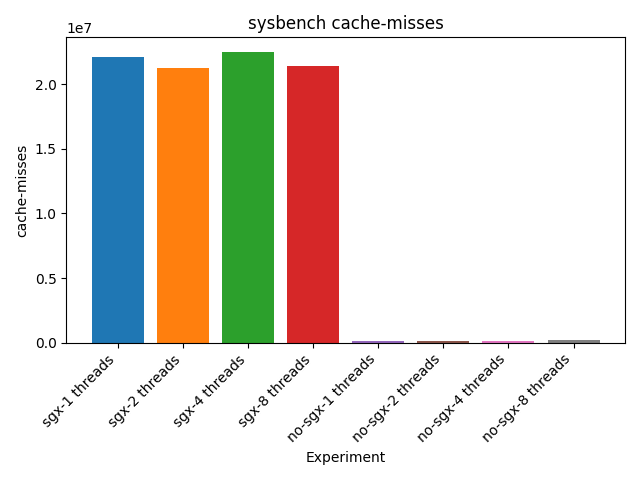
Cache misses for sysbench application

Cache references for sysbench application
Other counters like branch-misses and branch-loads are balanced between new applications

Branch misses for sysbench application
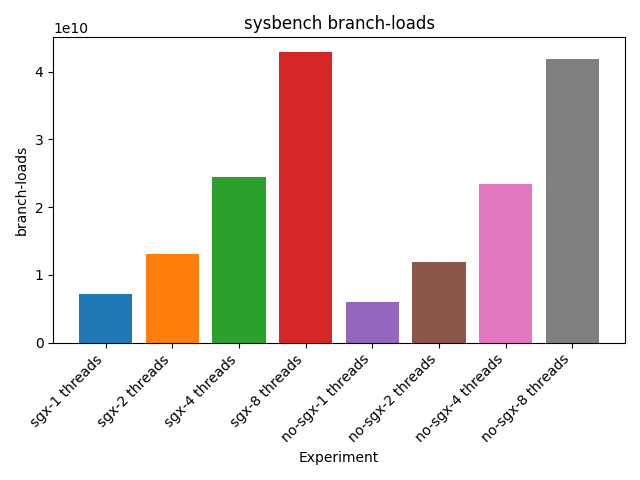
Branch loads for sysbench application